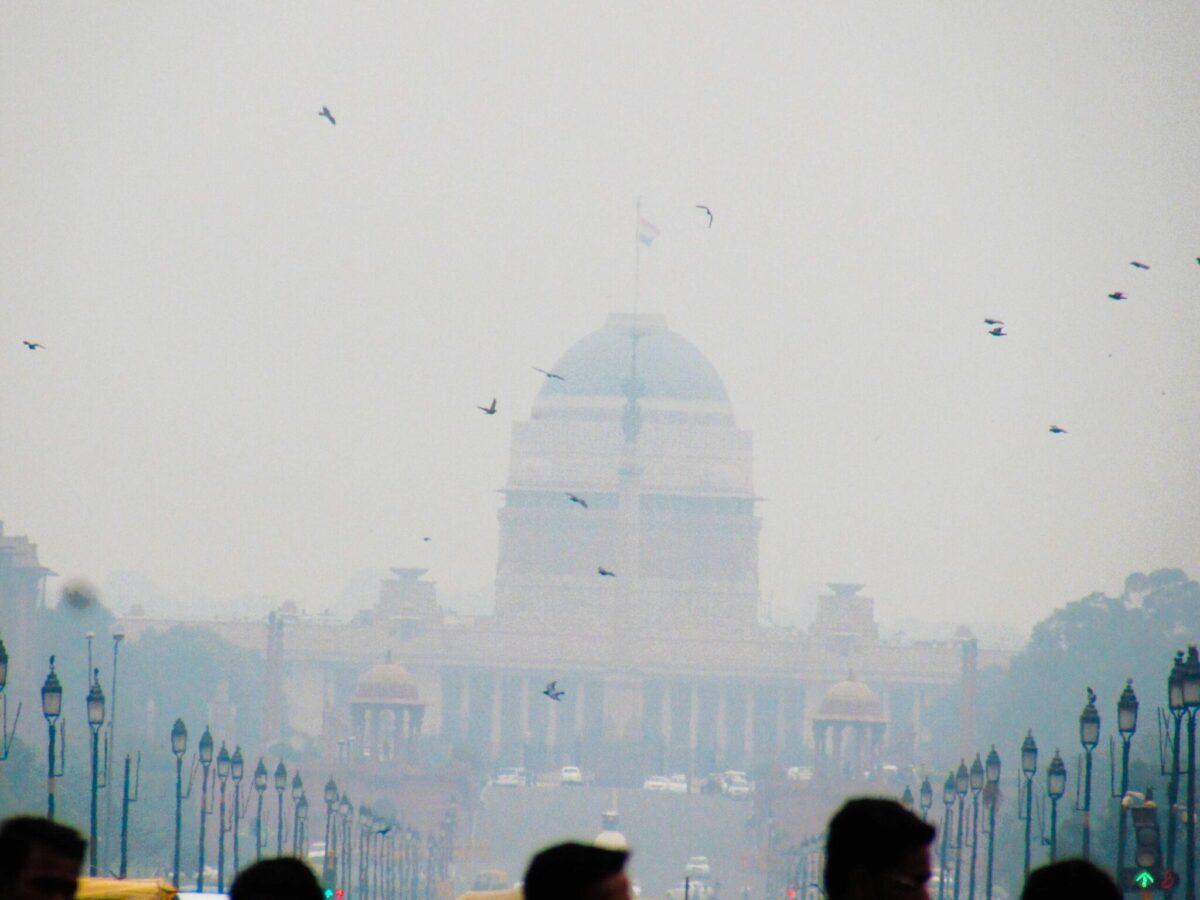
Most Polluted Cities In The World, The State of Global Air report and interactive website brings into one place a comprehensive analysis of the levels and trends in air quality and health for every country in the world. They are produced annually by the Health Effects Institute and the Institute for Health Metrics and Evaluation (IHME) along with the Global Burden of Disease (GBD) project and are a source of objective, high-quality, and comparable air quality data and information. As per the report Delhi and Kolkata top the list of most polluted cities in the world. Followed by Kano, Lima & Dhaka which ranks as the 5th most polluted city in the world. 5 cities from the Indian subcontinent find their place in the top 19 most polluted cities, with Karachi on the 8th rank and Mumbai on the 14th. 12 out of 19 most polluted cities are situated in Asia, while 6 African cities occupy other spots along with one South American city. Most of these cities are located in developing countries.
Air pollution is responsible for 1 in 9 deaths worldwide and accounts for 6.7 million deaths in 2019 alone. Of these, more than 4 million deaths were linked to exposure to outdoor fine particle pollution worldwide. Breathing polluted air increases a person’s risk of heart disease, lung diseases and respiratory infections, type 2 diabetes, and more. Mothers’ exposure to air pollution during pregnancy can lead to increased health risks for their infants.
Air pollution is complex, compositions or mixtures vary as per location and consist of particles and gasses emerging from a wide variety of natural and man-made sources. The report considers two main air pollutants found in cities:—
- Ambient outdoor fine particle pollution
- Nitrogen dioxide (NO2)
Fine particle pollution does not affect cities around the world evenly. In 2019, PM2.5 exposures across 7,239 cities ranged between 0.1 µg/m3 in Trabzon, Turkey, and 133 µg/m3 in Jhusi, India, with a global average of 34.6 µg/m3. On average, South Asia, West Sub-Saharan Africa, and East Asia cities reported PM2.5 exposure higher than the least stringent WHO interim target (35 µg/m3).
India and Indonesia have seen the most severe increase in PM2.5 pollution, whereas China after facing worse air pollution spells has seen the greatest improvements. Of 7,239 cities, India is home to 18 of the 20 cities with the most severe increase in PM2.5 pollution from 2010 to 2019. The other two cities are in Indonesia. All these cities saw an increase of more than 30 µg/m3 during that decade. Of the 50 cities with the most severe increase in PM2.5, 41 are in India, and 9 are in Indonesia.
Common sources in cities around the world include fossil fuel-based energy generation, industrial activities, and transportation. Other common sources of PM2.5 pollution in cities in low-and middle-income countries include burning coal and wood for cooking and heating in households, waste burning, dust from construction sites, etc..
Long-term exposure to PM2.5 pollution is associated with illness and early death from a variety of diseases including ischemic heart disease, lung cancer, COPD, lower respiratory infections (such as pneumonia), stroke, type 2 diabetes, and adverse birth outcomes. Ambient PM2.5 is the largest driver of air pollution’s burden of disease worldwide.
TABLE 1: Among the most populous cities in each region (N = 103), the top 19 with the highest population-weighted annual average PM2.5 exposures in 2019
| Rank | City, Country | Population-weighted PM2.5(µg/m3 |
| 1 | Delhi, India | 110 |
| 2 | Kolkata, India | 84.0 |
| 3 | Kano, Nigeria | 83.6 |
| 4 | Lima, Peru | 73.2 |
| 5 | Dhaka, Bangladesh | 71.4 |
| 6 | Jakarta, Indonesia | 67.3 |
| 7 | Lagos, Nigeria | 66.9 |
| 8 | Karachi, Pakistan | 63.6 |
| 9 | Beijing, China | 55.0 |
| 10 | Accra, Ghana | 51.9 |
| 11 | Chengdu, China | 49.9 |
| 12 | Singapore | 49.4 |
| 13 | Abidjan, Côte d’Ivoire | 47.4 |
| 14 | Mumbai, India | 45.1 |
| 15 | Bamako, Mali | 44.2 |
| 16 | Shanghai, China | 40.1 |
| 17 | Dushanbe, Tajikistan | 39.7 |
| 18 | Tashkent, Uzbekistan | 38.0 |
| 19 | Kinshasa, Democratic Republic of the Congo | 35.8 |
More than 1.69 million deaths linked to PM2.5 occurred in the 7,239 cities included in the analysis. They account for nearly 41% of global PM2.5attributable deaths for the year 2019, as reported by the GBD 2019 Study. Cities in East Asia (106 deaths/100,000 people), South Asia (86 deaths/100,000 people), Central Asia (78 deaths/100,000 people), Eastern Europe (78 deaths/100,000 people), and Central Europe (77 deaths/100,000 people) saw higher health impacts, which are reflected by higher regional urban median death rates attributable to PM2.5 than the global urban median.
TABLE 2 Among the most populous cities in each region (N = 103), the top 20 with the highest PM2.5-related disease burden in 2019
| Rank | City, Country | PM2.5- Attributable Death Rates (deaths/100,000) |
| 1. | Beijing, China | 124 |
| 2. | Chengdu, China | 118 |
| 3. | Kyiv, Ukraine | 114 |
| 4. | Kharkiv, Ukraine | 114 |
| 5. | Jakarta, Indonesia | 106 |
| 6. | Delhi, India | 106 |
| 7. | Shanghai, China | 105 |
| 8. | Kolkata, India | 99 |
| 9. | Bucharest, Romania | 90 |
| 10. | Călărași, Romania | 90 |
| 11. | Tashkent, Uzbekistan | 90 |
| 12. | Guangzhou, China | 90 |
| 13. | Almaty, Kazakhstan | 86 |
| 14. | Jieyang, China | 86 |
| 15. | Dhaka, Bangladesh | 86 |
| 16. | Katowice, Poland | 85 |
| 17. | Ashgabat, Turkmenistan | 79 |
| 18. | Budapest, Hungary | 78 |
| 19. | Warsaw, Poland | 77 |
- Brick kilns are an important source of outdoor PM2.5 and other pollutants across South Asia. In Nepal, a tragic earthquake in 2015 offered an unexpected opportunity.
- In China, following the launch of the National Air Quality Action in 2013, Beijing along with Tianjin and the Hebei province implemented a series of city and regional action plans between 2013 and 2017.
- In 2018, Ghana’s Environmental Protection Agency launched a detailed air quality management plan for the capital city, Accra, where windblown dust and activities such as traffic and e-waste burning contribute to poor air quality
- AirQo was launched in 2015 at Makerere University with the goal of addressing the data gap on air quality in Uganda and across Sub-Saharan Africa.
- Based on data from the Plan de descontaminacion del Aire para Bogota (PDDAB), Bogotá has reported a 20% reduction in the levels of particulate matter (PDDAB, 2020).
Tracking NO2 exposures also draws attention to urban air pollution concerns in regions that are not necessarily PM2.5 hotspots. Many cities in high-income countries in North America (e.g. Winnipeg, Canada and Fargo, United States), Asia Pacific (e.g. Seoul, South Korea and Asahikawa, Japan), and Western Europe (e.g. Paris, France and Albacete, Spain), as well as in Eastern Europe (e.g. Moscow, Russia and Minsk, Belarus) experience high NO2 exposures. Notably, NO2 exposures in some cities in North Africa and the Middle East (e.g. Beirut, Lebanon and Basra, Iraq), Latin America (e.g. Corumbá, Brazil and Arequipa, Peru), and Central Asia (e.g. Kyrgyzstan and Namangan, Uzbekistan) are high and continuing to increase.
TABLE 3 Among the most populous cities in each region (N = 103), the top 20 cities with the highest population-weighted annual average NO2 exposures in 2019
| Rank | City, Country | Population-Weighted NO2 (µg/m3) |
| 1. | Shanghai, China | 41.6 |
| 2. | Moscow, Russia | 40.2 |
| 3. | Tehran, Iran | 39.8 |
| 4. | Saint Petersburg, Russia | 38.3 |
| 5. | Beijing, China | 37.7 |
| 6. | Cairo, Egypt | 37.5 |
| 7. | Ashgabat, Turkmenistan | 36.8 |
| 8. | Minsk, Belarus | 36.8 |
| 9. | Istanbul, Turkey | 35.3 |
| 10. | Ho Chi Minh City, Vietnam | 34.7 |
| 11. | Dushanbe, Tajikistan | 34.4 |
| 12. | Seoul, Republic of Kore | 33.4 |
| 13. | Lima, Peru | 31.6 |
| 14. | Paris, France | 31.6 |
| 15. | Santiago, Chile | 31.2 |
| 16. | Tashkent, Uzbekistan | 30.4 |
| 17. | Baghdad, Iraq | 28.8 |
| 18. | Chengdu, China | 28.4 |
| 19. | Alexandria, Egypt | 28.1 |
86% of 7,239 cities still exceeded the WHO guideline for healthy air in terms of NO2 (10 µg/m3) in 2019 This percentage equates to about 2.6 billion people, almost 94% of all people living in cities included in this report. Four cities; Beirut, Shenyang, Shanghai, and Moscow, collectively home to over 53 million people— had NO2 levels exceeding even the least stringent WHO interim target of 40 µg/m3. Of the cities that met WHO guidelines for NO2, most are located along coastlines and have weather conditions that may help to disperse NO2 pollution (e.g. Suva, Fiji; Karangasem, Indonesia; and Mtwapa, Kenya).
As per 2022 WHO Air Quality Database revealed that only 74 countries have official ground-based monitoring stations for NO2 while 117 countries have monitoring stations for PM2.5 and PM10. Among the 20 cities experiencing the largest increase in NO2 levels between 2010 and 2019, only 5 have an official air quality monitoring station, and only 3 of them measured NO2.
However, it is important to note that the accuracy and certainty of the exposure estimates vary by region. Since ground measurements are incorporated in the model, estimates are less reliable for regions with fewer or no air monitoring stations (e.g., cities in Africa and Asia). In addition, estimates for coastal cities and cities with persistent snow or cloud cover also have higher uncertainty due to limited satellite coverage. Over time, more systematic and detailed data on emissions and traffic at the city level, as well as ground-level air quality data, can help improve the accuracy of the estimates.
