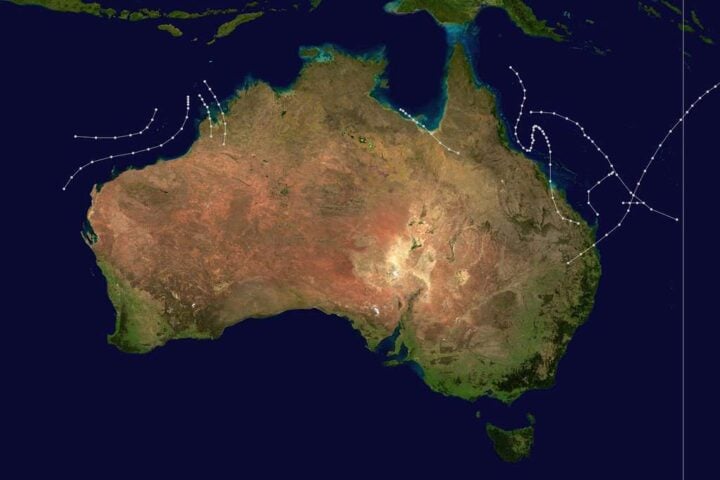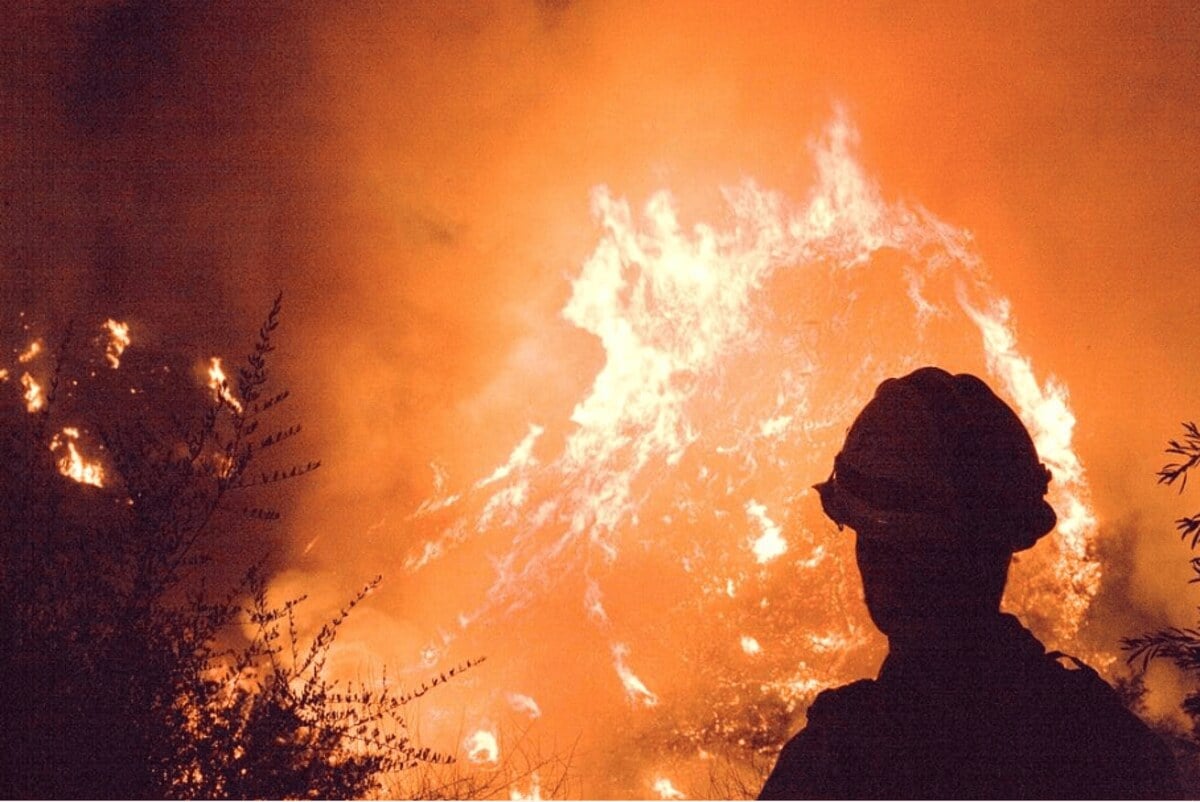
Cal Fire has released updated fire hazard severity zone maps for Southern California, revealing a dramatic increase in areas at risk. The new maps, which include Los Angeles County and surrounding regions, show an additional 3.5 million acres now classified within fire hazard zones.
The most concerning change is the 26% increase in “very high” hazard zones – the most dangerous classification. For Los Angeles County alone, an additional 440,000 acres have been added to hazard zones, with a 30% increase in the highest severity rating.
“Today’s release of updated hazard assessment maps from Cal Fire underlines the ongoing wildfire crisis that California is experiencing,” said Rep. George Whitesides in response to the new maps.
What The New Maps Mean
The maps divide fire risk into three categories: moderate, high, and very high. They assess hazard based on vegetation type, topography, climate, and weather patterns to calculate both the probability of an area burning and the likely intensity of potential blazes.
This is the first comprehensive update for local responsibility areas (where city and county fire departments respond) since 2011. Previously, Cal Fire only mapped “very high” zones in these areas, but the new maps now include “moderate” and “high” zones as well.
For homeowners, these classifications have real consequences. Properties in “high” and “very high” zones must follow stricter building codes, including requirements for fire-resistant materials and design features that prevent ember intrusion. Those in “very high” zones must also maintain defensible space around their properties and disclose this classification when selling.
Why Fire Risk Is Increasing
Multiple factors are driving the elevated wildfire danger:
- Climate Change: Rising temperatures, prolonged droughts, and drier vegetation have created ideal conditions for more frequent and intense wildfires.
- Urban-Wildland Interface Expansion: More people are living where urban development meets wildlands, increasing both the chance of human-caused fires and the number of homes at risk.
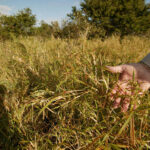
- Accumulated Dry Vegetation: Years of drought have left California’s landscapes filled with dead trees and dry brush that act as perfect fuel for wildfires.
Daniel Berlant, California state fire marshal, confirmed that the new maps “really just match with the conditions our firefighters have been experiencing for several years now.”
Similar Posts:
Community Impact Varies Widely
Some areas saw dramatic increases in their fire hazard zones:
- Jurupa Valley’s “very high” zone expanded from 226 acres to 6,195 acres
- Hesperia’s grew from 715 acres to 15,359 acres
- Chino Hills, Lancaster, and Santa Clarita each saw their “very high” zones grow by more than 13,000 acres
Interestingly, San Diego’s “very high” zone decreased by nearly 30%, though its total hazard acreage still increased due to the addition of “moderate” and “high” zones.
The Limitations of Mapping Fire Risk
The January Eaton fire highlighted some limitations in Cal Fire’s mapping approach. Only 21% of properties within the Eaton fire’s perimeter were previously designated as having “very high” fire hazard. Yet an independent assessment by First Street had identified 94% as having “severe” or “extreme” wildfire risk.
LACFD Deputy Fire Chief Albert Yanagisawa explained this discrepancy: “Cal Fire’s model is for wildland fire modeling. It’s not utilized and it shouldn’t be utilized for [urban] conflagration modeling.”
Cal Fire research manager David Sapsis acknowledged that their models cannot fully predict how wildfires spread into urban areas and noted they intentionally excluded “outlier” events like the 2017 Tubbs fire from their calculations.

What Happens Next
Local jurisdictions now have 120 days to receive public input, make adjustments, and begin enforcing heightened fire-safety regulations within the new zones. While they can increase the severity rating or add additional acres to zones, they cannot decrease severity or remove areas from the maps.
“For those working to rebuild after the Eaton fire, I want to emphasize that these maps provide essential information to guide your rebuilding efforts,” said County Supervisor Kathryn Barger.
The maps arrive at a critical time when California continues to grapple with the growing threat of wildfires. Experts point to multiple factors behind this trend, including development patterns and climate change.
What do the new Cal Fire hazard maps show? +
Cal Fire’s updated maps show which areas in Southern California are most likely to experience wildfires in the next 30-50 years. They categorize fire risk into three zones: moderate, high, and very high. The new maps reveal a 26% increase in “very high” hazard zones across Southern California, with 3.5 million additional acres now classified within fire hazard zones compared to the 2011 maps.
How do these fire hazard maps affect homeowners? +
Homeowners in “high” and “very high” zones must follow stricter building codes for new construction, including installing multi-pane windows and covering vents to prevent ember intrusion. Properties in “very high” zones must maintain defensible space around their homes and disclose this classification when selling. These designations can also impact insurance rates and availability for properties in higher risk zones.
Why are more areas at risk now compared to previous maps? +
The increased risk reflects several factors: climate change causing higher temperatures and longer droughts, continued development in wildland areas (called the urban-wildland interface), and more accumulated dry vegetation creating additional fuel for fires. The maps also use more advanced modeling techniques and updated climate data compared to the 2011 versions.
When will these new fire hazard maps take effect? +
Local jurisdictions have 120 days (approximately four months) to accept public input on the maps and work with Cal Fire to issue an official ordinance implementing them. Typically, these ordinances take effect about 30 days after they’re issued. At that point, the heightened fire safety regulations would apply to the newly designated zones.
Can local governments change these fire hazard zones? +
Local governments like Los Angeles city and county can increase the severity of a zone or add additional acres to a zone, but they cannot decrease the severity or remove acres from the zones designated by Cal Fire. This ensures a baseline of safety measures while allowing for local enhancements based on specific community considerations.
How accurate are these fire hazard maps? +
The January 2025 Eaton fire highlighted some limitations in Cal Fire’s mapping approach. While Cal Fire’s models are based on scientific data about vegetation, topology, and climate, they cannot perfectly predict how fires spread in urban areas. The models intentionally exclude “outlier” events like the 2017 Tubbs fire to avoid overly conservative zoning, which means some areas at risk during extreme wind-driven fires may not be captured in the highest risk categories.